
Monte Carlo Control Window
The Monte Carlo window is opened clicking the Toolbar icon either from PetroVR Plan or PetroVR Econ. It is the area where you define all the parameters necessary for running a Monte Carlo simulation.
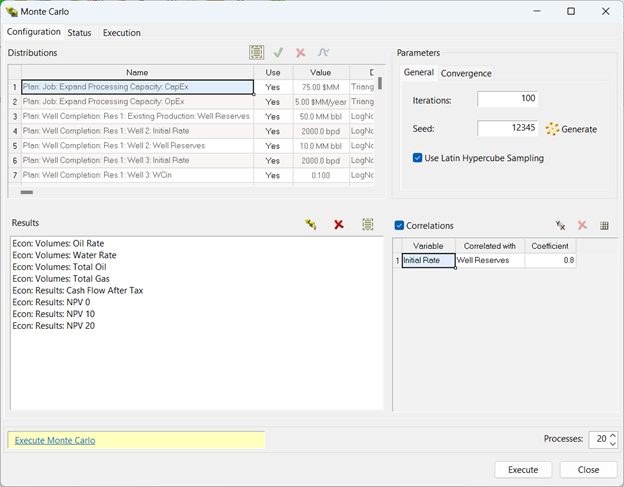
The Monte Carlo Distributions list contains all the Plan and/or Econ variables for which a distribution has been defined and which may have an impact on the simulation. Here you can select which distributions will be taken into account in the MC simulation. The Monte Carlo Results list below allows you to define which Econ results will be output by the MC simulation. The Monte Carlo Parameters pane defines the number of iterations and method to be used, and the Correlations list allows you to introduce correlations between the variables with distribution. After you have selected at least one Econ result you can run a MC simulation by pressing the Execute button. This will start a full-cycle Monte Carlo run where the entire Plan model and the economic model will be calculated in every iteration. During the simulation the following messages will provide details of the progress:
- Sampling: The distributions of the input variables are being sampled. This state is common to single- and Multi-Core Processing mode.
- Correlating: The samples of the input variables are being correlated. This state is common to single- and multi-core mode.
- Preparing to distribute: All the information required to run MC in an external process has been collected and packed for distribution.
- Distributing: All the external processes are launched and the information required to run MC is sent to them.
- Cancelling: The MC simulation is being cancelled. The cancellation performs some tasks that might take some time. For instance, in distributed mode, it is necessary to cancel the simulation in the external processes.
- Ending: When the MC simulation is finishing, whether it was cancelled or not, it performs some tasks that might take some time. Examples of these tasks are saving results, removing auxiliary files, etc.
 Run Reservoir MC link in the reservoir Reserves tab, the Monte Carlo control window will allow you to calculate volumetric uncertainty on the selected reservoir. In the Monte Carlo Results list, only volumetric results for the reservoir will be available for selection.
- On Server: Run the Monte Carlo simulation on the PetroVR Server. This feature is not enabled in the current version - contact the PetroVR Help Desk for more information on how to access this option.
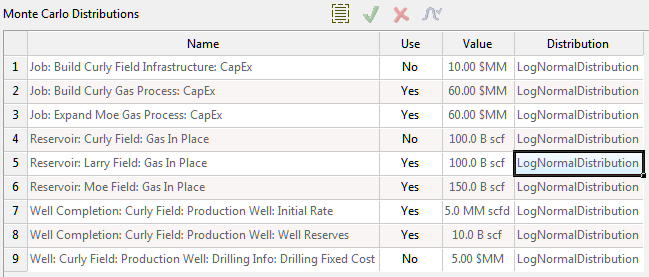
Monte Carlo Distributions list:
- You can activate/deactivate each variable in the Use column. You must have left at least one distribution set to Yes to run the MC simulation. You can
 select all the items in the list, and use the
 buttons to switch selected items between Yes and No.
  Edit the selected distribution in the Distribution Selection window (also available by double-clicking on the variable name).
Monte Carlo Results list:
 Select the Econ results you want to output as MC results.
- Remove selected results.
- Select all results.
Monte Carlo Parameters pane:
- Iterations: Number of iterations to be simulated in the next MC run.
- Seed: Seed number used as key for generating Monte Carlo samples. Use the
 Generate button to generate a random value. Keeping the same seed ensures that the same samples will be used in subsequent runs.
- Use Latin Hypercube Sampling: Activate this option to obtain different results by using the LHS technique, a.k.a. Stratified Sampling Without Replacement ().
- Cores: Select the maximum number of cores to be used in the simulation. See Multi-Core Processing.
Correlations table:
- Each row represents a correlation between two variables, that you enter in the Variable and Correlated with columns. Enter a Pearson coefficient under the third column; see Distribution Correlations.
 Add a correlation.
 - Remove selected correlation.
 Edit selected correlations in a matrix; see Distribution Correlations.
Converge Tab
- Stop when the mean of variable: Activate this option if you want to stop the Monte Carlo run when Petro VR detects that convergence is reached and no more iterations are required to get a meaningful result. The logic of Convergence detection is to check the running mean of a given variable during the Monte Carlo run. If the value of the selected variable remains between a given boundary during the specified number of iterations, Convergence is reached and the run stops.
- Variable: You can choose from the list of Results included in the run. Only single-value variables with numeric values can be selected for convergence (and not Date, Boolean or Text variables).
- Precision: A value expressed in the units of the selected variable, defining the boundaries, both positive and negative, around the current mean.
- During: The number of iterations during which the variable value must remain between the boundaries defined by the Precision field for Convergence to be reached.
Execution Tab
This pane includes the Simulation Log and the Convergence graph.
The Converge graph shows the runtime evolution of the selected convergence variable’s mean value. A vertical progress bar at its side provides feedback on the current count of iterations between a convergence boundary. If the mean value crosses the boundary, the count is reset to zero.